
Dogs of my Neighborhood
- Grant Wiersum
- May 31, 2022
- 5 min read

Updated: Jun 22, 2022
Inspired by the Jeffery Lewis song "Dogs of my neighborhood" What can we learn about a neighborhood's character by the dogs who live there?
I have a 4-year-old Dalmatian by the name of Aesop. In looking for a neighborhood I'd want to move to, there's very little more important to me than finding him a place with lots of other dogs he'll be able to play with well. He most likes to play with working and sporting breeds. A neighborhood with an overabundance of toys or terriers would be a red-flag for high rents and limited greenspace. Hopefully we can find a zip code or two we could call home.
import json import folium import pandas as pd import numpy as np #Our basic dataset provided by the City of New York df = pd.read_csv('https://data.cityofnewyork.us/api/views/nu7n-tubp/rows.csv?accessType=DOWNLOAD') df.head(10)
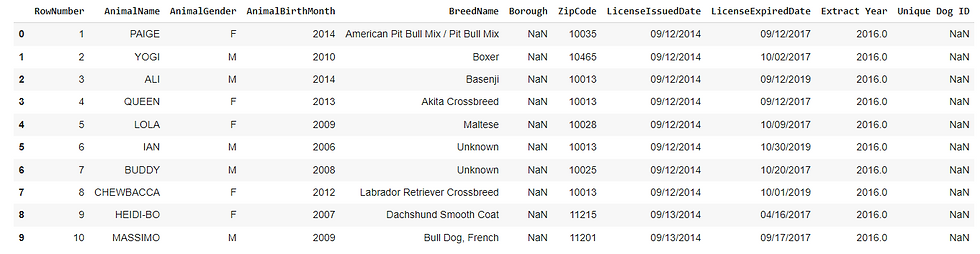
A quick look at the dataset gives us a good look into what's being logged by the city. We'll drop "RowNumber", "Borough", and "Unique Dog ID" to get down to info we can use.
df.drop(columns = "Borough", inplace = True)
df.drop(columns ="RowNumber", inplace = True)
df["AnimalBirthMonth"].unique() # There are some really old doggos in here!
Looking through the output of unique birth-years, we see some dates that might not be entirely valid. I'm not sure if the Lanape kept dog registration records.
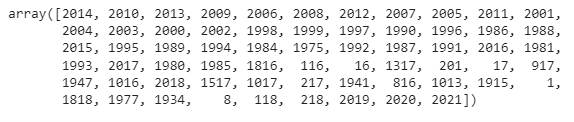
Anyhow, we'll drop any dogs that are more than 14 years-old, since they get pretty chill, and might have moved to the country.
df = df[df["AnimalBirthMonth"]>2008]So now let's do some visualization of the pups who still live in New York.
First step is with Bash - Downloading a map we can put our data on.
!curl 'https://raw.githubusercontent.com/fedhere/PUI2015_EC/master/mam1612_EC/nyc-zip-code-tabulation-areas-polygons.geojson' > './geo.geojson'I'm using 100 as a floor for the number of registered dogs, less than that, and it's either a mis-entry or a hard place to live.
The geoJson format stores zips as str so we have to cast the NYC zips to str. From looking at gross numbers, the top neighborhoods would be the upper west side, the village and Brooklyn (which I'm including because I'm a dirty hipster, They Might Be Giants is from there, and this is my project.)
dog_counts = pd.DataFrame(df.value_counts(subset=["ZipCode"]), columns = ["num_dogs"])
dog_counts = dog_counts[dog_counts["num_dogs"]>100]
dog_counts.reset_index(inplace=True)

dog_counts["ZipCode"] = dog_counts["ZipCode"].astype(str)

geo = './geo.geojson'
So let's load the formatted dataset into our Choropleth map. Zoom to the right location, and tell it what features to base its color-coding on.
map = folium.Map(location=(40.7265, -73.9815), zoom_start=12)
folium.Choropleth(geo_data = geo,
                  name = "Dogs of my neighborhood",
                  data = dog_counts,
                  columns = ['ZipCode','num_dogs'],
                  key_on="feature.properties.postalCode",
                  fill_color = "YlGn",
                  fill_opacity=0.7, line_opacity=0.2,
                  legend_name="How many dogs per neighborhood?").add_to(map)
folium.LayerControl().add_to(map)
Not a ton of surprises - right? The Upper West-side is a great place for dogs. Brooklyn is a barkin' good time. Chelsea and the Village might be nice too.
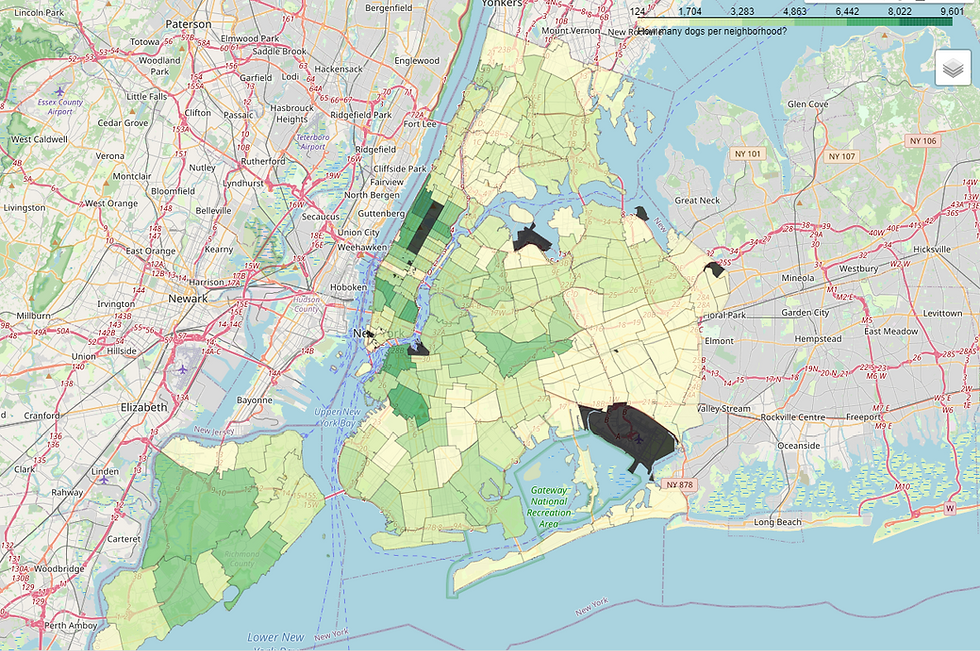
I wonder if there's a way to narrow in on which neighborhoods are the most playful? Do they even like frisbees in Alphabet city? Are there any tennis balls in Manhattan Valley?
df[df["ZipCode"]==10011]["BreedName"].value_counts().head(10) 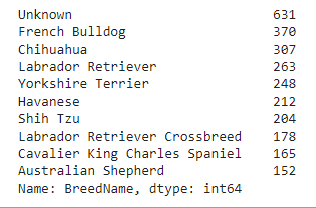
At first glance, Chelsea looks promising but the per-breed breakdown makes me think twice. Maybe these aren't the most playful bunch. Don't get me wrong. I love frenchies and labs but something tells me we can build some better indicators about the tone of a given neighborhood.
Now we need to define a function to figure out what group each dog in our set falls into. I'm going to spare you this part. I decided to build a dictionary that relates every recognized breed to its AKC group. If you're interested, I lightly modified the 'dog-breeds to dog-groups' lists kaggle user Andras posted. You can find that here:
Or view my source code.
The effect was that I coded every dog in the dataset into one of the above groups or "other". Much of the data won't directly match the AKC recognized breed name so we're also going to classify mixes as however they "present" - i.e. if it looks like a lab (mix), it's a lab.
groupdict = dict(zip(breeds,groups))
grouplist = list(set(groupdict.values()))
df["BreedName"] = df["BreedName"].str.replace(" Mix", "")
df["BreedName"] = df["BreedName"].str.replace(" Crossbreed", "")
Data cleaning is one of those Zeno's paradox things where you can only ever half-way finish. Here's some of the more relevant issues:
df["BreedName"] = df["BreedName"].str.replace("Bull dog", "Bulldog")Poodles are always "None" or "Toy" but maybe that's ok - I'm not sure what they are either. For this one I'm ok with "None"
"Pitbulls" in their many flavors, aren't actually AKC recognized and are usually considered terriers by ADBA. Their temperament, build, history and disposition though, make them closer to "Working" for the purposes of this project.
Here's that operationalized:
from difflib import SequenceMatcher

def breed_matcher(ny_breed):
  akc_group = None
  for breed in breeds:
    if breed in ny_breed:
      akc_group = groupdict[breed]
    elif ny_breed in breed:
      akc_group = groupdict[breed]
    elif "Bull Dog" in ny_breed:
      akc_group = "Non-Sporting"
    elif "Pit Bull" in ny_breed:
      akc_group = "Working"
    elif "Hound" in ny_breed:
      akc_group = "Hound"
    elif "Terrier" in ny_breed:
      akc_group = "Terrier"
    else:
      similarity = 0
      akc_breed = None
      swap_similarity = SequenceMatcher(None, ny_breed, breed).ratio()
      if swap_similarity > similarity:
        akc_breed = breed
        similarity = swap_similarity
  return akc_group


ny_group_dict = {}
for breed in df["BreedName"].unique():
  ny_group_dict[breed] = breed_matcher(breed)
Which gives us a nice map of which breeds are in which groups.
So let's run the above function and map dogs into their groups.
df["Group"]=df["BreedName"]
for breed in ny_group_dict.keys():
  df["Group"].replace(breed, ny_group_dict[breed], inplace = True)

group_list = ['Herding', 'Hound', 'Non-Sporting', 'Sporting', 'Terrier', 'Toy', 'Working', None]
group_counts = {}

for zip in df["ZipCode"].unique():
  group_counts[zip] = df[df["ZipCode"]==zip]["Group"].value_counts()

group_df = pd.DataFrame(group_counts).transpose()
group_df["ZipCode"] = group_df.index.astype(str)
group_df.reset_index(inplace = True, drop=True)
group_df.fillna(0, inplace=True)
group_df.head(10)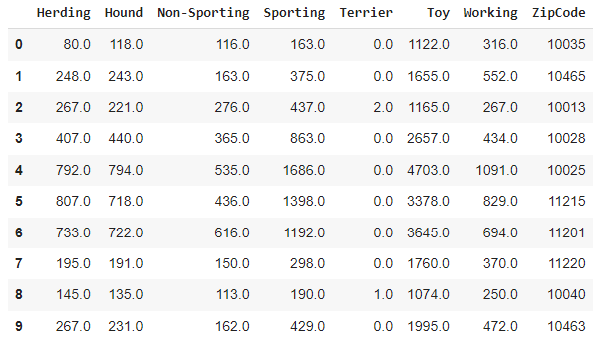
Now we're getting somewhere! Let's convert these into proportions of "yappy dogs" and "good friends"
#Let's sum up the good friends:
good_friend_count = group_df["Herding"]+group_df["Sporting"]+group_df["Working"]+group_df["Hound"]
good_friends = pd.DataFrame.from_dict({"ZipCode" : group_df["ZipCode"], "Good_Friends" : good_friend_count})

#And the...not so good dogs to play with.
yappy_dogs = group_df["Terrier"]+group_df["Toy"]
good_friends["Yappy"] = yappy_dogs

# And now let's boil it into a Yappiness index which we'll use to see what proportion of dogs are yappy.
good_friends["Yap_index"] = good_friends["Good_Friends"]/dog_counts['num_dogs']

good_friends
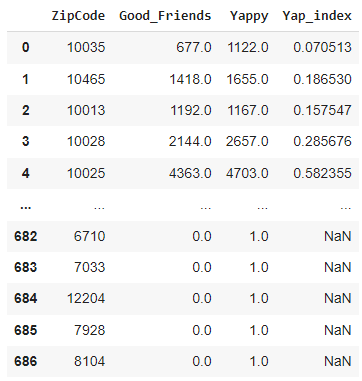
So we now have a Yap-index next to every zip-code which represents the proportion of dogs that are most likely to be good friends, relative to the total number of dogs. (Higher is better)
geo = './geo.geojson'

map = folium.Map(location=(40.7265, -73.9815), zoom_start=12)
folium.Choropleth(geo_data = geo,
                  name = "Dogs of my neighborhood",
                  data = good_friends,
                  columns = ['ZipCode','Yap_index'],
                  key_on="feature.properties.postalCode",
                  fill_color = "YlGn",
                  fill_opacity=0.7, line_opacity=0.2,
                  legend_name="How yappy is my neighborhood?").add_to(map)
folium.LayerControl().add_to(map)

map
Chelsea looks a lot less inviting now, huh? But check out east-village!
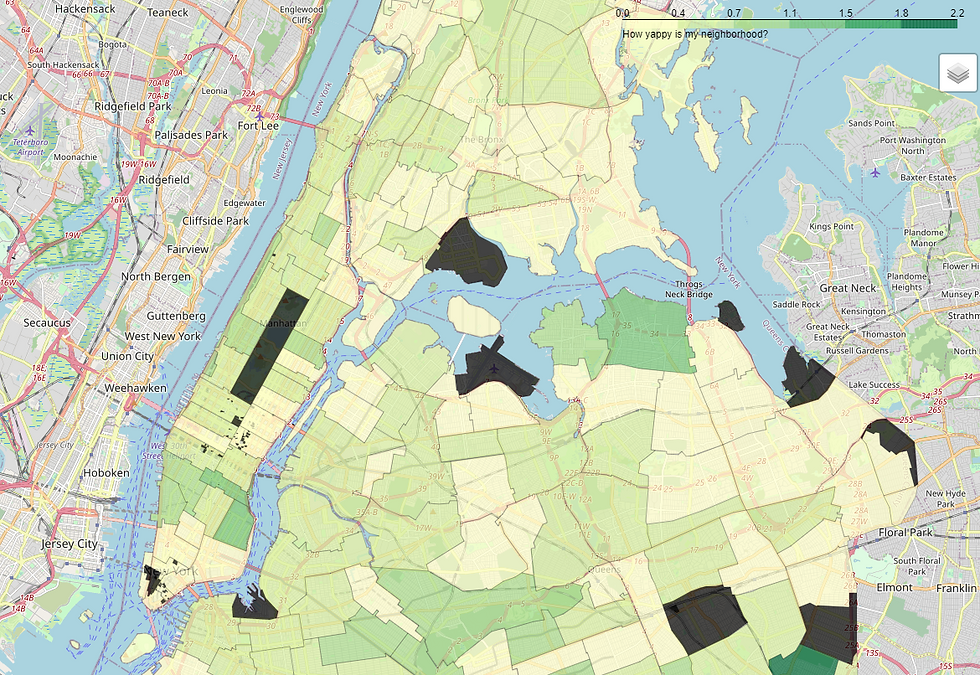
I bet Tompkins Square is a great place to meet all sorts of cool dogs.
So, by generating an index of which neighborhoods have the biggest dogs, We find that the East Village in particular seems to be at the top of the list.
Then again, by using data from only registered dogs, we skew our data a certain way.
Another way to look at the problem might be to check dog-bite data.
Since you can't get bitten by a dog that doesn't exist but can get bitten by an unregistered dog, we end up with a very different heatmap:
bites = pd.read_csv('https://data.cityofnewyork.us/api/views/rsgh-akpg/rows.csv?accessType=DOWNLOAD')
bite_counts = pd.DataFrame(bites.value_counts(subset=["ZipCode"]), columns = ["num_bites"])
bite_counts.reset_index(inplace=True)
bite_counts["ZipCode"] = bite_counts["ZipCode"].astype(str)
bite_counts["Per 1k"] = bite_counts["num_bites"]/(dog_counts["num_dogs"]/1000)
dog_counts = dog_counts.merge(bite_counts, on="ZipCode")
print(dog_counts.head(5))

map = folium.Map(location=(40.7265, -73.9815), zoom_start=12)
folium.Choropleth(geo_data = geo,
                  name = "Gross Bites by Zip Code",
                  data = dog_counts,
                  columns = ['ZipCode','num_bites'],
                  key_on="feature.properties.postalCode",
                  fill_color = "PuRd",
                  fill_opacity=0.7, line_opacity=0.2,
                  legend_name="Dog Bites of New York").add_to(map)
folium.LayerControl().add_to(map)

map
What's going on in Harlem?
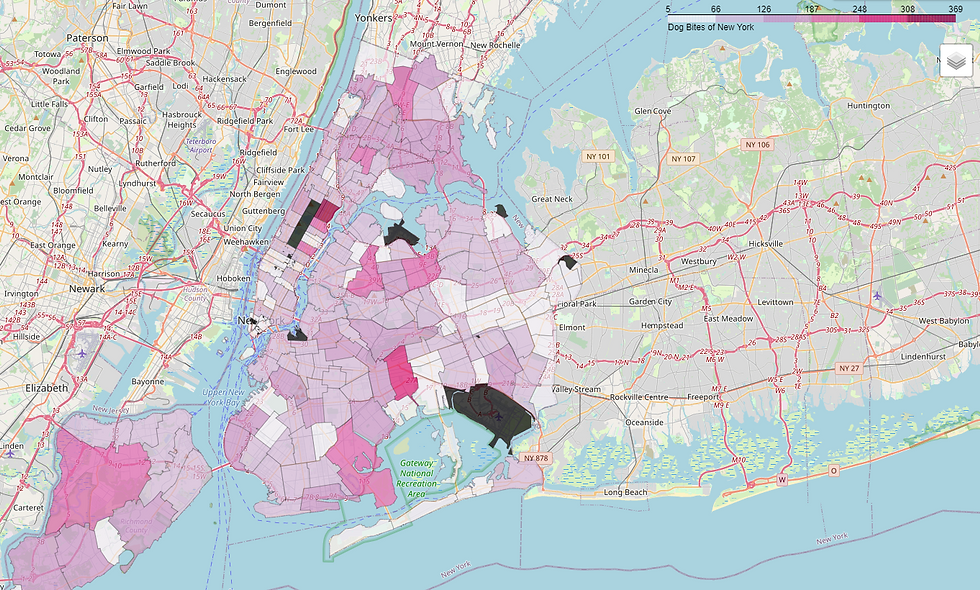
This leaves us with some insight and some further questions. East-Village has high rates of non-yappy dog registration and very low dog-bite incidence relative to the rest of Manhattan. Harlem may be home to an astounding number of poorly socialized dogs (possible but not probable), may be home to a dog rehabilitation clinic (which is true) that reports a large number of bites (dubious) or may be home to a large "undocumented" dog population which is, in my opinion, the most likely single explanation. So while Queens and Staten Island are clearly good places to have a crazy dog, I don't know if the bridge-and-tunnel life would be for me. I hate driving and would rather play fetch than commute. Harlem is high on the list, but while these are all good options, I think the best one is the home of the artist whose music inspired this notebook - Alphabet City and the East Village.
Keep it chill East-Vill. See you next time.


Comments