
BERT for mRNA: Using Variational Autoencoders to Reduce Dimensionality of Bulk mRNA Data
- Grant Wiersum
- Dec 28, 2023
- 5 min read

Background
The cornerstone of traditional distance calculation (Hosangadi, 2012), (Thompson et al. 2005) is the multiple sequence alignment (msa). In an MSA, sequences are matched nucleotide-to-nucleotide and a score is given to each nucleotide pair that either matches, is mismatched, or presents a gap matching later in the sequence. By these methods pairwise distances can be computed for the entire corpus of sequences, giving a highly detailed view of relatedness within a dataset. MSA leaves several inefficiencies however, and recent work on alignment-free analytical methods have made great strides. Until recently much of this progress has focused on Markov-chain-based methods (Ren et al, 2018).
To gain better understanding of how and why two populations of cells vary, dimensionality reduction methods are leveraged to great effect (Luo et al. 2021). Principal component analysis (PCA), K-means clustering, and the more modern t-Distributed Stochastic Neighbor Embedding (t-SNE) and Uniform Manifold Approximation and Projection (UMAP) are indispensable methods for understanding any highly dimensional data. What can become a drawback, however, is the inability of these methods to fully reconstruct the data from which they were generated. Increasingly, these traditional methods are bias-prone and typically poorly suited to the task of highly dimensional, noisy, and seldom linear variables.
In recent years, the deep-autoencoder has emerged as the artificial-intelligence solution to unsupervised clustering problems (Hinton and Salakhutidinov, 2006), outperforming traditional methods of dimensionality reduction across multiple tasks. Autoencoders function differently than typical neural networks. Rather than attempting to perform a regression task, autoencoders in two phases. First encoding data -- reducing input dimensionality into a smaller number of simulated neurons. Decoding consists of attempting to reconstruct the original data from the encodings. By using the amount of information retained as the optimization function, autoencoders converge on a solution which retains the nuance of the incoming dataset. This strength is furthered by the interpretability of the outputs. Autoencoders have built-in feature extraction in that one of the outputs is the reconstructed input, greatly simplifying analysis of hidden layers.
Methods
Several peer reviewed studies have been previously published successfully applying autoencoders to the problem of RNA-seq deconvolution (Chen et al, 2022), (Wang and Gu, 2018), (Yang et al, 2022). These models have demonstrated state-of-the-art performance using less training data than previous methods. The paper “The full-length transcriptome of C. elegans using direct RNA sequencing” (Roach et al, 2020) provides a high-quality dataset of bulk RNA-seq reads in unedited, .fastq format. These reads were collected from larval nematodes at larval stages L1, L2 and L3 and Young adults, as well as male-only, and gravid-adult samples. Samples were processed by Illumina nanopore sequencing. Data was accessed from the National Library of Medicine’s Sequence Read Archive. Mean read length was 784.5 base-pairs, (sd +/- 598.9bp)
Because the goal of this project is to provide a foundation for further research, the Autoencoder itself will follow an extremely basic structure. For this analysis, the method described by Hinton and Salakhutdinov was adapted for use on bulk RNA-seq data.
Fastq data was read from files by Biopython (Cock et al, 2009). Sequences were then one-hot encoded and trimmed or padded to meet a set-length context of 1000 base-pairs. The built-in Pytorch Dataset class was used to facilitate data prefetching. The autoencoder was implemented in Pytorch. The encoder consists of 5 densely connected 1-dimensional convolutional layers, connected by ReLU activation and scales from a 1000x4 input array to 16x4 latent encoding. The decoder exactly replicates the encoder’s structure in reverse, scaling from 16x4 up to a 1000x4 output. The model was optimized with a Mean-squared-error (MSE) loss function calculated against the input versus the output
Best performance was achieved when a relatively low learning rate was used, with a starting value of 0.01 and a weight decay of 1e-5. The model was trained over the entire available dataset on an Nvidia GeForce RTX 3090 GPU.
Results
The resulting model was used to compare two samples from the dataset. Accession numbers ERR3245464 (Larval stage 1) and ERR3245466 (Larval stage 2) were selected and the first 100,000 reads from each file were encoded into 64 eigenvectors. These eigenvectors were then reduced by uniform manifold approximation projection (UMAP) for visualization and further processing. By this method, outliers are easily identified. For example, the highest value on UMAP value 1 is a sequence reading “AAAAC”. Another outlier, when run through NCBI BLAST returns “Quercus” (Oak trees) as the genus.
To identify areas of differential gene expression, a 2-dimensional histogram was plotted for each expression profile. The densities of these histograms could then be subtracted from one-another and areas largest difference could be identified.
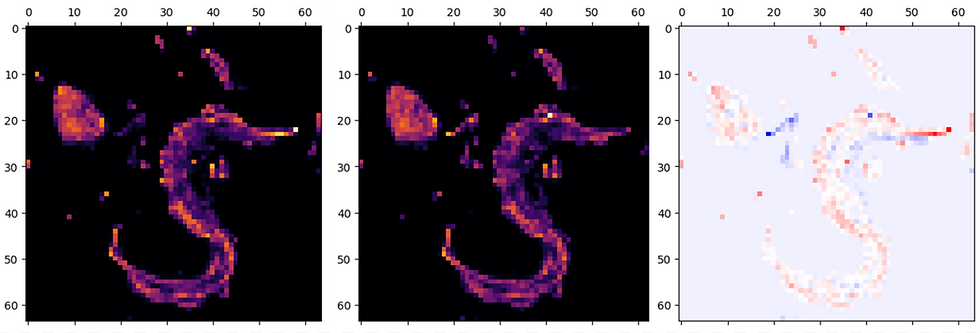
The resulting plots of gene expression show clear differences in density. At present, many of the genes identified remain uncharacterized and could pose interesting avenues for further research.
Discussion
Further work should include transformer layers in the encoder and decoder. By taking attention into account, further denoising is possible (Vaswani et al, 2017), (Ran, Gao and Fang. 2022). This model was severely limited in size due to limitations of the available hardware. Great difficulty was encountered in finding data suitable for this limited demonstration. With larger, more sophisticated models, it may be possible to produce encodings which capture a greater fraction of the total data. While only a modest success, this model does demonstrate the ability of neural networks to perform distance calculations on genomic data. Once trained, these networks can process hundreds-to-thousands of sequences per second using commonly available, consumer-grade hardware.
This analysis includes no metrics of efficiency or accuracy versus the established methods of either alignment-based distance determination, nor dimensionality reduction. These considerations would be key in any further investigation. It should be noted that due to the nature of GPU-accelerated workloads parallelization is exceptionally simple. Once a model is established, the much less computationally intensive task of inference can be distributed due to the “embarrassingly parallel” nature of the problem.
One possible next step in furthering this research may be to apply a larger model toward the problem of single-cell RNA-seq deconvolution. By generating a “fingerprint” for each cell through autoencoder-generated embeddings, it may be possible to classify cells with very high accuracy.
References
Chen, Y., Wang, Y., Chen, Y. Cheng, Y., Wei, Y., Li, Y., Wang, J., Wei, Y., Chan, T.F., Li, Y. (2022) Deep autoencoder for interpretable tissue-adaptive deconvolution and cell-type-specific gene analysis. Nat Commun 13, 6735 https://doi.org/10.1038/s41467-022-34550-9
Cock, P. J. A., Antao, T., Chang, J. T., Chapman, B. A., Cox, C. J., Dalke, I, Freidberg, I., Hamelryck, T., Kauff F., Wilczynski, B., de Hoon, M. J. L. (2009) Biopython: freely available Python tools for computational molecular biology and bioinformatics, Bioinformatics, V 25-11 June 2009, 1422–1423, https://doi.org/10.1093/bioinformatics/btp163
Coward, S., Visse-Martindale, E., Ramesh, C. (2020). Attention-based Clustering: Learning a Kernel from Context. Arxiv 2010.01040. https://doi.org/10.48550/arXiv.2010.01040
Hinton, G. E., & Salakhutdinov, R. R. (2006). Reducing the Dimensionality of Data with Neural Networks. Science, 313(5786), 504–507. http://www.jstor.org/stable/3846811
Hosangadi, S. (2012) Distance Measures for Sequences. ArXiv. 1208.5713 https://doi.org/10.48550/arXiv.1208.5713
Luo, Z., Xu, C., Zhang, Z. Xu, C., Jin, W. (2021) A topology-preserving dimensionality reduction method for single-cell RNA-seq data using graph autoencoder. Sci Rep 11, 20028. https://doi.org/10.1038/s41598-021-99003-7
Ran, R., Gao, T., Fang, B. (2022). Transformer-based dimensionality reduction. ArXiv 2212.8288. https://doi.org/10.48550/arXiv.2210.08288
Ren, J., Bai, X., Lu, Y.Y., Tang, K., Wang, Y., Reinert, G., Sun, F. (2018), Alignment-Free Sequence Analysis and Applications. Annual Review of Biomedical Data Science, 1:93-114 https://doi.org/10.1146%2Fannurev-biodatasci-080917-013431
Thompson, J.D., Koehl, P., Ripp, R., Poch, O. (2005) BAliBase 3.0: Latest Developments of the multiple Sequence Alignment Benchmark. Proteins Structure, Function and Bioinformatics 61:127-136. https://doi.org/10.1002/prot.20527
Vaswani, A., Shazeer, N., Parmar, N., Uszkoreit, J., Jones, L., Gomez, A., Kaiser, L., Polosuhin, I. (2017) Attention is All You Need Conference on Neural Information Processing Systems 31. https://doi.org/10.48550/arXiv.1706.03762
Wang, D., Gu, J. (2018). VASC: Dimension Reduction and Visualization of Single-cell RNA-seq Data by Deep Variational Autoencoder. Genomics, Proteomics & Bioinformatics, 16(5), 320–331. https://doi.org/10.1016/j.gpb.2018.08.003
Yang, F., Wang, W., Wang, F., Fang, Y., Tang, D., Huang, J., Lu, H., Yao, J. (2022) scBERT as a large-scale pretrained deep language model for cell type annotation of single-cell RNA-seq data Nature Machine Intelligence 4, 852-866.


Comments